Tuesday, February 27, 2007

Happy Birthday to me ... to me .... to me ....

Just like an unruly child, the Confused Capitalist has passed his first birthday on this earthly plane (... this blog was started February 18 2006), with a happy smile on his face.

Hopefully, I've written something a little bit different from everybody else and something that others have found worthwhile; I've generally had fun doing this. A promotion in the latter part of last year kept me busier than usual, hence the relatively infrequent blogging over the past six months.

However, as the Confused Capitalist enjoys writing both as a means to learn, self-inform, and teach others, I will be launching an environmental/global warming blog later this year. I hope some of you might wander over there when this is launched for some ideas, insight and discussion as we move towards a sustainable future, before all the natural systems begin completely failing.

In the meantime ... happy birthday to me ... happy birthday to me ... to me ... :-)


JW

The Confused Capitalist

Saturday, February 17, 2007

How Low Can You Get? Extremely Low PEs Crush Market Averages

A series of stories on extreme low PEs is interesting in that it shows two things:

Firstly, that the "Rise of The Machine" has value for investing purposes (i.e. automatic selection without further human intervention, once the investment criteria rules are written).

This is currently being exploited through many semi-active and enhanced ETFs, like the Power Shares, Wisdom Tree and Claymore Investment types, and through "value screen" investing.

The second interesting thing is that extreme value situations crush market averages.

Here are the stories of John Dorfman's extreme value investing via his "Robot Portfolio":

2006 Portfolio
2005 Portfolio
2004 Portfolio
2003 Portfolio
2007 Canadian Version

I hope these stories prove useful to you.

JW

The Confused Capitalist

Sunday, February 11, 2007

The Only Three Questions That Count

This is part 2 of 2, relating to a review of Mr. Fisher's book. The first segment is here.

I have some issues with Mr. Fisher's book and some of his "revolutionary" thinking. Given the tone of his book, I'm certain he would be absolutely dismissive of what I have to say but, nevertheless, I'm going to charge in anyway.

Mr. Fisher's big opening statement in his book challenges a long-held market axiom that high PE's denote reduced returns for some period of time into the future. He states that the year immediately following a high PE year has virtually no statistical inverse correlation. While this might be true, it ignores the fact that there is heightened risk of a reduced return into the relatively near term future. Whether that lower return is realized in the immediate year following, Mr. Fisher's data suggests, no.

However, an investor (rather than a "speculator" or "trader") would be foolish to ignore the reduced odds of outperformance that this period provides. For some further information and a detailed study on this issue, please go over to this Gannon On Investing series, which discusses this in greater detail. (Use the top navigation link to continue moving forward in this interesting series). Essentially, Mr. Gannon's work shows that poor returns (perhaps not the immediate year following) generally follow high PE years.

I find that his presentation and discussion of the data is of considerably more value to me than Mr. Fisher's more short-term consideration. In terms of data presentation, in Mr. Fisher's book, in an attempt to convince that there's virtually no correlation between PEs and market returns, he presents what he calls a "Bell Curve" showing relative PEs. Here is a truncated version of his "Bell Curve":

(see Figure 1.3 on page 18 of the book).

When I look at this, it doesn't remind me of a Bell Curve, which I always understood to look something like this ...

... so when I look at it, my mind still tries to fit a rough bell curve to it. What I can clearly see is that, on the periphery, there appears to be a clear correlation between average returns and PEs. For instance, the average return from the 11 occurrences in the far left hand (low PEs) column is 20.0%. If I aggregate all the small right hand columns (High PEs), this totals some 17 occurrences, and the average return there is just 6.5%.

Perhaps a better way to think about this, I arrive at, is that in the middle values, the PE isn't the most important determinant of future return. But on the edges, it's clearly very important. Geoff Gannon's work certainly supports this thesis too. But I know that Mr. Fisher would probably be completely dismissive of me, attributing my criticisms to my inability to ditch an old world view.

Later in the book, he puts to rest another worry, that high government deficits and debt result in poor market returns. Don't Worry!, his research shows, Be Happy! I'd say that the way he approaches this theme is similar to the first; he takes the short term view and therefore "proves" this doesn't impact the market.

I look at it like this: while the party is going on with borrowed money, all looks great. There's no evidence to suggest that the house will be trashed the next morning and in dire need of repair. Party on dudes!

However, over the longer term, a sensible brain would say that the money is going to have to be paid back, and given the the US already has one of the lower tax regimes in the developed world (suggesting that the opportunity for service cuts are somewhat limited), how will this money likely be paid back? Hummm, by raising taxes, perhaps even corporate taxes?? And when taxes are raised, what is that likely to do to corporate profits, or at least profit growth rates?

In summary, I find that Mr. Fisher often takes a relatively short term view in framing his questions, more akin, in my view, to a trader, than a long-term investor. Having said that however, and despite my criticisms here, I still think that the book is a worthwhile read.

Just be careful how you use the outcome of some of the questions that Mr. Fisher frames.

Feb 13/07: I have added this post-script because I think I have probably been somewhat harsh in my criticism of this book. What makes it worthwhile, in my opinion, is that it's one of the very few books out there that shows how a "top-down" approach might succeed.

Most books - mine included - tend to focus on "bottom-up" approaches that focus on relative and absolute valuations. Some wander off into the "asset-allocator" field as a sideline, but few provide any indication of how a top-down approach might be successfully employed and some tools to do that with. Mr. Fisher's book does that.

However, I'd still be cautious as to using the exact answers that Mr. Fisher comes up via his own questions, as I believe there's an inherent amount of risk in ignoring certain longer-term probabilities [something I think that many of Mr. Fisher's questions do] - i.e. poorer longer term returns when investing when PEs are high; and government deficit and debt situations that may act as trigger events for market debacles.


JW

The Confused Capitalist

Saturday, February 10, 2007

Investment Cycle clock

I thought that this graphic, by Merrill Lynch, was worth looking at in terms of where they see the economy in the cycle, and the type of investments they generally see as outperforming during any particular part of the cycle.

The other thing I thought I might try taking a stab at is how long each portion of the cycle typically lasts. Based only on my observation over time, I might suggest that the cycle has roughly 3,4,2,1 counts. My (un)educated guess is that the recovery portion usually is 3 helpings of time, the boom is 4 portions of time, the slowdown is 2 portions and the recession is 1 portion of time.

Using something like this clock may help you to time your type of investments a little better.

Hat tip to the Big Picture for this worthwhile graphic and also to his continuing coverage of the housing situation. Unlike many analysts, Barry Ritholtz has figured out where that particular train is headed (and it's not to the "Happy Days Are Here Again" station, just yet).


JW

The Confused Capitalist

Sunday, January 28, 2007

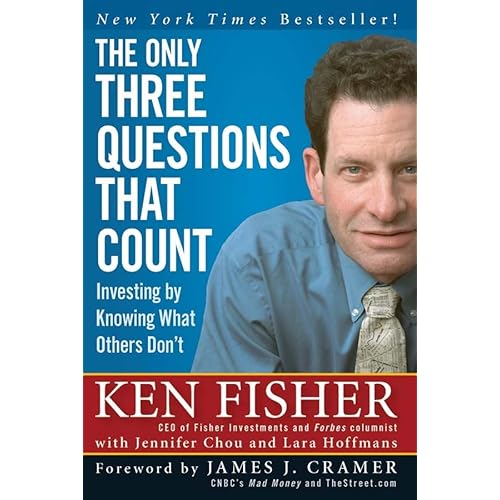
Book Review: The Only Three Questions That Count, by Ken Fisher

Ken Fisher is one of the richest men in America and is a renowned investment manager, following in the footsteps of his - also famous - investor father, Philip Fisher. Each approaches/ed investing with different styles on how to make money.

Philip was a proponent of a concentrated basket of stocks, chosen in relatively few sectors in which one might gather some deeper knowledge over time, and in which relatively exclusive and important information ("scuttlebutt") might be known.

Ken Fisher, the author of this book, on the other hand is more of a top-down, "value-screen" guy, who recommends staying relatively close, asset-class percentage-wise, to a broad-based benchmark. He also recommends a broad portfolio of about 50 stocks. Despite the obvious differences in styles, each style has proven to be successful, respectively, for father and son, and for those who follow. But success only happens for those followers who are willing and able to ask the suitable questions needed to succeed for each investment style.

Ken's style revolves around asking the following three questions:
(1) What do you believe that is actually false?
(2) How can I fathom what others find unfathomable?
(3) What the heck is my brain doing to blindside me now?

Asking the first question calls on you to challenge yourself to find or analyze data to show what you believe is actually false. By uncovering this, we can invest in a different way than we had previously, and in a a different way that many people believe to be true (which is actually false), and, thus, swimming before approaching tide is seen by all, succeed in outperforming the crowd. Catching the early rise of the wave, if you will. Using this question, Ken purports to show that investing when price-earnings ratios (PEs) are high isn't a sign of poor returns to come. This is his big signature statement that challenges a long-held market axiom. More on this in another posting to follow.

The second question calls on you to look for relationships where some (sensible) economic theory can explain what might occur in the future, based on demonstrated relationship to something else that has proven to have some predictive power (correlation). The question can also be stated as "What causes X?".

The final question relates to considering how various behavioural cognitive reasoning flaws might be sabotaging your success as an investor. I have written about many of these factors on my blog before, and these are often highlighted at Abnormal Returns or CXO Advisory, and it's nice to see that the importance of these are becoming more widely written about.

In general, I found the book to be worthwhile, filled with lots of practical tips and thoughts; and the application of the questions cannot but help make you a better, more astute investor over time.

However, I have two issues with the book:

Firstly, I find that Mr. Fisher is very condescending or even downright insulting to some specific people, or classes of people - based on their chosen profession. I find the first to be juvenile and needlessly insulting, while in the second instance he engages in negatively stereotyping a "class" of people, an attribute I frankly have some trouble understanding in a person of his obvious intelligence. In this regard, I think Mr. Fisher should try to display a little more maturity, and tact. As you can probably tell, this behaviour irritated me to a considerable degree.

Secondly, I have some issues with Mr. Fisher purporting to show that high PEs don't denote high market risk. My problem with the posing of his question, rationale and presentation of the "facts" in relation to this will be discussed in a future posting.

Until then, stay safe and use the three questions to consider the investment world in general, and the questions answered in Mr. Fisher's book in particular.


JW

The Confused Capitalist

Sunday, January 21, 2007

The value of doing nothing ...

Left: Superior investor Rip Van Winkle.

According to a recent news item by investment newsletter tracker Mark Hulbert, results from tracking both investment newsletter writers, professional mutual fund managers and even individual investors, results attained by measuring the performance of "last year's portfolio" is better, on average, than the results of the current portfolio.

In the newsletter example given, "yesterdays" portfolio beat the current one by, on average, 80 basis points. This is outperformance - measured against one's own investing skills - which is not to be sneered at.

As Hulbert put it, the logical conclusion to arrive at in portfolio changes then becomes ...
... what these results do suggest is that we should place a large burden of proof on making a change in our portfolios. Unless the arguments in favor of such a change are particularly compelling, we probably should simply do nothing.

Doing nothing, however, is harder work than most investors want to subject themselves to.


JW

The Confused Capitalist

Saturday, January 13, 2007

Ticker Sense Poll Participant

The Confused Capitalist has been thinking about its weekly participation in Birinyi Associates Ticker Sense's "Weekly Blogger Sentiment Poll". The poll asks the question ... "What is your outlook on the US stock market for the next 30 days?"

After some consideration, The Confused Capitalist will no longer be participating in this poll. Unfortunately, the time frame asked about is too short to measure anything but, essentially, the sentiment of the moment, rather than speaking to longer term trends and relative valuation levels.

Market movement over such short periods of time are almost solely based on emotion, random occurrences, or virtually unforeseeable events. While I admire the attempt to do something different from others (such as this poll), I have to weigh that against suggesting that investment bloggers - who have many neophyte investors as readers - are able to divine market trends over such a short period of time.

If the question was re-worked to indicate a longer time frame, such as forecasting a market outlook over the next 18 to 36 months, then The Confused Capitalist will duly reconsider its position (if so asked). However, I would also like to thank Birinyi Associates for the honor of being an inaugural participant in this poll.


JW

The Confused Capitalist

Wednesday, December 20, 2006

My Investing Christmas List

Like any investor, I wish for the next year to be full of market-beating returns.

But, rather than wish for this directly, here's my list of products or things I'd like to see that I think could help do that job over the next year:

10. A fundamentally-indexed (broad-based, not just on dividends) BRIC ETF;
9. A fundamentally-indexed (broad-based, not just on dividends) Euro ETF;
8. A fundamentally-indexed (ibid) global bank ETF;
7. Finding a wonderful proxy investment on the cusp of a major breakout;
6. More quality screening tools, like Magic Formula Investing;
5. A fundamentally-indexed (ibid) Japanese ETF;
4. A fundamentally-indexed (ibid) global small growth companies ETF;
3. A complete proliferation of fundamentally-index (ibid) EFTs;
2. Double-leveraged ETFs of all of the above and, finally;
1. More patience, so that I may reap the rewards of proper analysis, rather than falling victim, as so many have over the years, to the following saying ...
A man may see straight and clearly and yet become impatient or doubtful when the market takes its time about doing as he figures it must do… the market does not beat them… they beat themselves, because even though they have brains they cannot sit tight.
Merry Christmas to all ... may you and your loved ones have a fabulous time this holiday season ... no matter your beliefs, nationality, or any thing else for that matter ...


JW

The Confused Capitalist

Sunday, December 10, 2006

Outperformance for widows .... and others too!

I have written recently about the need to outperform the standard capitalization-weighted indices, such as the S&P500, the DJ Industrial averages and the S&P/TSX Composite. It's not only important for those folks who need to plan their retirement, but also for younger widows/widowers who may not have a grand source of income, but have received a decent inheritance.

Assuming that their home is paid off, and they end up with the tax-free equivalent of 10 years salary, they might want to look at having the equivalent of eight of those years salary invested into the stock market. All at rates intended to protect the principal from inflation (meaning that it continues to grow), but also allows a decent income to be claimed from the portfolio. The balance might be invested in money market and bond issues, and used to draw short-term living expenses from.

Again, I think using ETFs that track some type of fundamental index (in other words, a index that is based on value-type measures [eg price/book, PE ratios, free-cash flow growth, and dividend growth/payments], such as some of the RAFI indexes) offers a much greater chance for outperformance, and with enhanced safety of capital. (See video, here, on why fundamental indexation is a better mousetrap). In other words, having your cake and eating it too. What could be sweeter?

Again, I think that these type of portfolios can be very robust, and also very simple. For instance, if I was advising my wife, I would probably suggest that the stock portion of the portfolio be weighted toward dividend growth/paying ETFs (given the need for income, and the documented outperformance that these types of stocks have delivered over time) and might look something like this:

The Claymore Canadian Fundamental Index (CRQ) ETF has been designed to replicate the performance of the FTSE RAFI Canada Index, which comprises those Canadian companies with the highest fundamental weightings. The index weights constituents using four accounting factors, rather than market capitalization. These four factors include:
  • Total cash dividends (five-year average of all regular and special distributions)
  • Free cash flow (five-year average cash flow)
  • Total sales (five-year average total sales)
  • Book equity value (current period book equity value)
This index has produced a return of 13.3% since January 2000, versus only 6.5% for the TSX60 over that same period, suggesting that the ETF would have produced a parallel return, deducting only for the small MER of ETFs (instead of the giant 2.0% to 2.5% most mutual funds charge). I would suggest a 20% weighting for this ETF.

Claymore Canadian Dividend & Income Achievers (CDZ). Weighted to emphasize stocks that both have a relatively high yield, and also have a good track record of raising their dividends. It tracks the Mergent Canadian Dividend Income and Achievers (fundamental) index. Over the past five years, the index has posted a 15.1% annual gain, versus the S&P/TSX Index return of 11.1% annually. Over ten years, it posted an 18.1% annual return, versus an 11.0% return for the S&P/TSX Composite Index. The underlying holdings are around 55-60 stocks typically. I would suggest a 20% weighting for this ETF.

Claymore US Fundamental Index, C$ Hedged (CLU). This ETF also tracks another fundamental index, which tracks the top 1,000 US securities by fundamental value, using the following four factors: cash dividends, free cash-flow, total sales, and book equity. This ETF is also attractive from my point of view, in that I think the US dollar will be lower in 10 years than now, but this ETF hedges against currency changes, meaning that we'll only trap the underlying changes in the index. Over five years, this index has returned a 7.0% rate annually, versus a -3.2% S&P 500 annual return (as converted to Canadian currency). The underlying holdings are around 1,000 stocks. I would suggest a 20% weighting for this ETF.

Claymore BRIC (CBQ) is the final Claymore product, that portfolio manager Roger Nusbaum has also written about. This ETF isn't fundamentally indexed, but is designed to mirror the BNY BRIC Index, which tracks ADRs from Brazil, Russia, India and China, all powerful emerging economies. Over time, this should be a strong growth component, but one which will also be volatile in nature. This index has returned 33.2% annually over the past four years, versus the more widely known MSCI EM Index, which has returned 19.7% annually over the same period. The ETF has 75 underlying stocks with above average concentration in the first ten stocks, with about 53% of the value held therein. This isn't currency hedged or denominated in Canadian dollars, but this could be a plus if these currencies gain strength against the Canadian dollar over the next decade. I would suggest a 20% weighting for this ETF.

Finally, for the fifth ETF, I'll suggest a product that trades on the American exchanges, a Wisdom Tree ETF product that tracks the Wisdom Tree International Dividend Top 100 Index (DOO). This is also a fundamental index, based on dividend yield of large and mega cap international companies. Currently, about 80% of the companies in the index are domiciled in Europe, with about 20% in Australia, Singapore and Hong Kong. The index has returned 16% annually over the past five years, as denominated in US Dollars. Conversion to Canadian currency over that time would have considerably diminished these returns to about 8.5% annually (which is still respectable, although not outstanding). While the currency issue may be slightly negative over the next decade, I don't think it's going to weigh down returns like it did over the past five years, or like it might for an unhedged US stock situation going forward. I would suggest a 20% weighting in this ETF.

Well, that's it. A relatively simple portfolio, with ample geographic representation, and wide corporate representation. The one noteworthy thing about this portfolio is that it's definitely weighted to the financial sector, but I've never considered that a particular problem, since I consider this sector as the backbone of the entire economic system. My theory here is that if this sector suffers some sort of serious long-term decline, so will virtually every other sector of the economy.

Finally, the other noteworthy aspect is the ability of high-dividend paying stocks to resist market downturns, something that might make this particular portfolio even more attractive; certainly, it makes it easier to sleep at night.

Now, the only thing that would need to be done by your proverbial widow, is simply to "re-balance" this portfolio back to the same 20% weightings, about every three years or so. This allows the winners to run for a while, and also to take advantage of longer-term "reversion to the median" and relative underpricing in the portfolio.

Of course, the widow would want to check out other sources of fundamental ETFs, such as Claymore Investments, Wisdom Tree and Power Shares in case she prefers a slightly different weighting using fundamental indexed ETFs. Finally, she should of course take the whole idea to a fee-only financial planner for critique and tweaking.


JW

The Confused Capitalist

Monday, November 20, 2006

Outperforming the index - split shares

I recently came across a compelling paper that suggests that the good S&P 500 returns of the past are unlikely to be replicated into the future. I suggested that, for younger investors particularly, outperforming the index would be a matter of prime importance. I'd also suggest that the paper has similar implications for Canadian investors too.

I had also indicated I'd write on some relatively simple methods to outperform the index.

One that I'd like to re-visit is the idea of leveraged share structures, or leveraged funds. (Leverage: see the dangers 1, 2)

For an investor with a relatively long time line, say more than 10 years, many of these types of structures are ideal to enhance returns. They leverage underlying shares or indices and can provide a greater than average return, provided that you have sufficient time to ride out the shorter-term volatility associated with this type of leverage.

For instance, two split-shares available on the Canadian market (TSX), LSC and ALB, provide access to, respectively, the four largest Canadian life-insurers and the six largest Canadian banks. Generally, the banks and insurers have proven to be prodigious wealth-producers over time. These returns are enhanced by the leverage structure of 1.69x and 1.99x on the "capital shares", respectively, so these shares should move up or down at the underlying share rate, multiplied by that factor.

What you don't want to do is buy them when the underlying shares are over-valued. While absolute measures are somewhat subjective as to value in today's market, both corporate sectors appear to be relatively good value.

To arrive at that conclusion, I surveyed three fundamental ETFs, the IShares XCV product, a measure of Canadian value stocks. I also surveyed the Claymore Investments fundamental ETFs, CDZ (dividend-based value), and CRQ (tracks value based on four fundamental factors). In all of these three ETFs, at least four of the six banks hold a weighting in the top eight securities, while the insurers weren't too far behind, with three of the four insurers taking weightings within the top 18 spots in all those ETFs. This suggests that they are relatively cheap in the Canadian market.

Another split share, SNH.U (capital shares), tracks the Health Care portion of the S&P500; its' underlying composition is similar to the SPDRs health-care ETF, XLV. It's largest holdings are in Pfizer and Johnson & Johnson, two stocks that have recently attracted a lot of buying from the guru value set, suggesting that they too, are reasonably priced. Another recent report stated that on a historical-basis, this group is trading in the 3rd percentile of its' historical cash-flow range, indicating that valuations in the health care sector are fairly attractive at this time. But you have to be able to handle the leverage factor, in this case at 2.86x.

Therefore, using a split share structure that leverages the long-term growth and relative cheapness of these various sectors is probably a good thing for long-term performance. Which is one reason why I hold all of the above in my personal portfolio.


JW

The Confused Capitalist

Friday, November 10, 2006

Canada - Hitting the Sweet Spot

A recent Goldman Sachs study reported that Canada topped the rankings for economic growth potential of all G7 nations, surpassing both the US and Germany, and now holds 6th spot of the 170 countries tracked.

The past few years have seen a string of successes for Canada, the roots of which were formed when, in the middle 1990s, the federal government made positive strides to eliminate a seemingly perpetual bugetary deficit. Since then, the federal government has recorded its ninth consecutive budget surplus, as controlled costs and booming commodity prices have led to an enviable situation.

After a tough 1990s, it's nice to be on the right economic track. Now, if we can only do something about our productivity woes, a problem that threatens to plague a future generation.


JW

The Confused Capitalist

Sunday, November 05, 2006

Canada - Income Trusts - No Trust

The Canadian government (a Conservative minority) announced this week that existing income trusts, who pay little to no corporate taxes, would begin paying full corporate taxes in 2011. For those on the block to conversion to income trust status to eliminate paying corporate taxes, the income trust tax of 34% would be applicable immediately.

Two recently announced conversions, BCE and Telus, which themselves would have deprived the government of $1.1 billion annually in taxes, placed this in the government's "must take action" in-tray, despite a recent election promise that income trusts would be left alone. The opposition Liberals had pondered the very same move last fall when then in government, leading to a large drop in the income trust market at that time. The trust market had, however, largely bounced back since then.

A quotation from this story more or less synopsizes why the government, despite it's earlier pledge to leave the trust sector alone, felt it had to act:

Had the entire TSX converted to income trusts, it had the potential to be disastrous not just for government revenues but for Canadian productivity, although many companies would have likely gone back to the market for investment capital.

The action on the part of the government led to a 13% average drop in that sector this past week. However, many have speculated doesn't reflect the underlying valuation change due to having a significant tax burden imposed. Some experts suggest that in the weeks and months ahead, this sector, which now constitutes about 10% of the TSX Composite Index value, is slated to see further weakness.

The howling from trust-owning pensioners has been predictable, given that most trusts were bought for their income yield, typically ranging from 6-11%, which is pretty juicy in today's environment. Many of these pensioners claim to have "lost trust" in the Conservative government.

It is interesting to note that this same structure began to gain some prevalence in the US, Australia and Britain, a number of years ago, before legislators recognized the tax-shift burden that would fall to the middle class, and shut down the advantageous tax rates for them. However, they did this before these structures had gained the widespread popularity, as they have in Canada.

In this regard, Canada is simply following suit, but with many asking the question: Why did it take so long here?


JW

The Confused Capitalist

Wednesday, October 25, 2006

Why outperforming the S&P 500 must become a priority for younger investors

This is a longer than average post, but if you are in your 20s, 30s or 40s and are counting on a decent retirement based on a financial planners' estimate of a 10% market return or so, I suggest you stick with this and read it through. For many readers, this will be eye-opening to say the least.

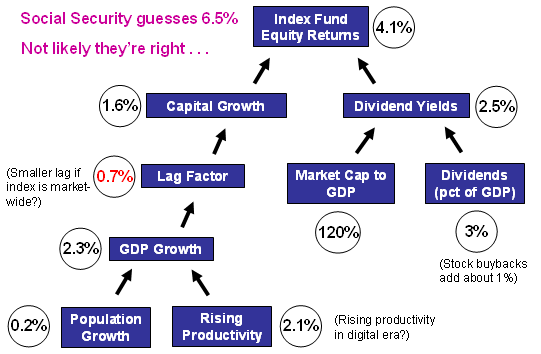
The following diagram is from work of Steven Johnson of Simcivic.org and illustrates what he believes the future composition of the return rate (see below) of the S&P500 is likely to be (with inflation extracted): (Future returns above: Click to enlarge)

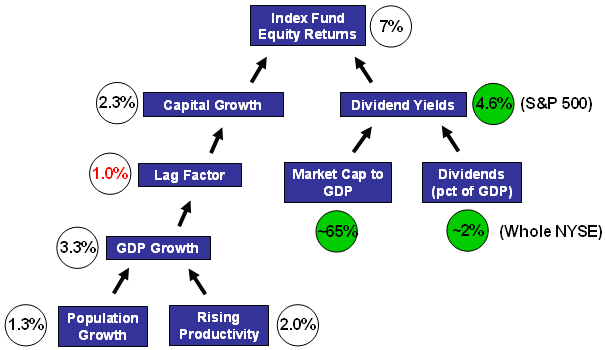
In this diagram, Mr. Johnson has outlined what he believes the constituent parts of future stock market returns are likely to be (inflation excluded). This shows a 4% return or so, compared to a historical 7% return (again, inflation excluded), which he calculates as having been historically produced by the following constituent components (see below: historical return):

(Historical returns above: Click to enlarge)

Adding inflation back into both figures, produces an anticipated future return rate of about 7%, versus a historical 10% or so. While a 3% differential doesn't sound large, over a 30 year period, this differential amounts to $10,000 being turned into $76,122 (7%) or $174,494 (10%). [Both figures now include an inflation component of an additional 3%.]

As you can see, the difference between these two figures could significantly affect your retirement planning. Mr. Johnson makes a pretty compelling case that the returns of the past cannot be relied upon as a reasonable guide for indicating the returns of the future. It's different this time he claims: this time in a negative sense!

In the paper Mr. Johnson argues that stock market returns arise from two primary sources. These are capital growth, historically accounting for about 2.3% of the 7% long-term (ex. inflation) rate; and dividends - including re-investment and share-buybacks - accounting for about 4.6% of the 7% (ex. inflation) historical return. Together, the two components produce a ~7% return (1.023 x 1.046 = ~ 7% return).

Mr. Johnson then further deconstructs the return to be able to analyze what might happen in the future, given known trends. The capital return factor (~2.3% historically) is the result of three things:
  1. Population growth in the 20th century of about 1.3% per annum;
  2. Plus rising productivity of about 2.0% per annum;
  3. Less a lag factor of about 1%
Producing a net 2.3% factor on the capital growth side.

On the dividend side, the components there are the actual dividends paid compared to the overall economy and the market capitalization of the stock market, compared to the overall GDP. Historically over the past seventy years, this has averaged 65% or so.

The ratio of dividends paid, measured by the GDP of the economy has remained relatively constant, at about 2% of the GDP. Accounting or adding for stock buy-backs, this figure rises by about 1% to become about 3%.

The 3% dividend figure is then divided by the denominator, which is the ratio that the stock market has been capitalized at compared to the GDP of the economy (historically about 65% as a long-term average), produces the aforementioned 4.6% figure.

Reiterating, the two components produce a ~7% return (1.023 x 1.046 = ~ 7% return).

Mr. Johnson argues that in the future, these underlying rates will be different (mostly lower), due primarily to two trends:

  1. Population growth is slowing, and he uses a 0.2% annual estimate (from Social Security figures) instead of 1.3%. This alone lops off more than 1%.
  2. The stock market has gradually been valued as a higher and higher percentage of GDP. This is the denominator of the dividends return portion. In fact, this appears to be on an upward trend that Mr. Johnson believes may average out at 120% of the GDP, nearly twice the historical level. Given the massive trend of the average person now investing in the market - compared to being a rich man's playground 50 years ago - it's hard to argue with this idea, even if the figures might not prove exactly right. Dividing the dividends of 3% by the average capitalized 120% ratio produces a dividend yield of about 2.5%, some 2% below what Mr. Johnson estimates this portion historically produced.
Incidentally, the falling yield portion as a value of stocks is pretty indisputable, and can be seen on one of the numerous charts within the paper that help make all this understandable, and compelling.

Hopefully, I have explained this well enough that most people can understand the basics of it, even if some of the subtly is lost. I cannot impress upon you strongly enough that you go and read the paper yourself, and try to understand the implications for your retirement planning.

I will be writing more on market outperformance in the future, and re-visiting some ideas from some of my older postings.


JW

The Confused Capitalist

Tuesday, October 24, 2006

Salute to Abnormal Returns

Disaster has struck!

Abnormal Returns, the finest investment blog in the blogosphere, has decided to take a brief break from the task of blogging. How will I get my daily fix of top-quality investment-related information?

Whether Abnormal was writing on behavioural-related investment issues; or on portfolio allocations and the need to provide advice that does no harm; or about thinking more critically sharply about positive studies you might be hearing about; or about the prospect that a commodity bubble has occurred (or least that future returns in this sector are likely to be relatively weak); or theme-oriented aggregations (such as this example on fundamental indexes/ETFs); or one of my personal favorites, a posting on "proxy investing", Abnormal brought a great deal of insight or information to our attention.

Even when I disagreed with the thesis, there was no mistaking that this was a very knowledgeable serious investor here. And a damn fine writer too.

And of course, there was the daily litany of links, many well-outside the investment world per se, that highlights an active, curious and and interested mind.

The writer of this blog and the writings herein have directly benefited from the active mind of Abnormal Returns. Abnormal Returns is, in my opinion, by a country mile the best overall investment blog out there, one that I visit daily, and cannot recommend too highly. I therefore grant Abnormal Returns the highest honor as shown here ...
May I suggest you visit or revisit Abnormal Returns for edification, erudition, and illumination?


JW

The Confused Capitalist

Saturday, October 21, 2006

I love you, I really, really, do

Are investors too much in love with stocks these days?

The reason I ask this question is obvious, given the recent Dow Jones records, but my interest was piqued by accidentally tapping a link that took me to the msn money web-site.

The so-called "Stock Scouter" on the site purports to show that in three categories of a) sector type, b) investing styles, and c) market capitalization ranges which is "in favor", "neutral", or "out-of-favor". Guess what?!

In all three categories (sectors, styles and capitalization ranges), there isn't a single thing that is "out of favor". Is this one of those contra-indicators, suggesting that the market is priced to perfection, with nowhere to go but down?


JW

The Confused Capitalist

Wednesday, October 18, 2006

Learning, ever learning

One thing I love about the markets, is that there is so much to learn. To become a better investor, you must want to learn more and then put that knowledge to use.

Stockcoach recently wrote a great posting about one of his favorite sites to learn from, CXO Advisory. I too enjoy the insights that this site affords.

To become better in the markets necessarily involves continuous learning, both about strategies that can better the market, and also your own inner human psychology.

Many strategies to beat the market are fairly simple, straightforward, and well known. Studying these things for a while, allow you to come to know them. Further incremental improvement is possible, by learning more advanced techniques. However, many market-beating strategies, it has often been said, can be written on a matchbook cover.

Buying low book-to-value stocks, for instance, is a perenial winner on the whole. As is buying low PE stocks. As is buying stocks with a record of increasing dividends. All well-known, market-beating, strategies.

Implementing and sticking with those strategies is something else altogether, for many, many people.

Two quotations I recently posted on my site relate to fundamental reasons for market underperformance. In my view, most underperformance can be traced to poor emotional control, particularly patience. Both sayings touch on the subject ...

Most of man's troubles come from his inability to sit and be quiet for 20 minutes.
- Pascal (b. 1623, d. 1662)

A man may see straight and clearly and yet become impatient or doubtful when the market takes its time about doing as he figures it must do… the market does not beat them… they beat themselves, because even though they have brains they cannot sit tight.
- From Reminiscences of a Stock Operator, published 1923.

Most investors would do well to ponder these sayings, both before they set their strategy, and after. Just as I have, and continue to do so - to improve my performance.


JW

The Confused Capitalist

Sunday, October 15, 2006

Completed labelling

I have completed back-labelling all my posts, so if you had turned off an RSS etc. feed, you now will only be getting new posts and could turn it back on without fear of a tidal wave of old postings.


JW

The Confused Capitalist

Thursday, October 12, 2006

You got a problem with that?

Have your good intentions of investing perhaps turned into something else, something else you fear has become a gambling addiction?

With the rise of the internet, discount brokers and the rapid fire world we live in, it's all too easy for some investors to turn into gamblers, in the world biggest casino - the world's stock markets.

According to psychologist Paul Good, if you exhibit five of the following 11 traits, you most likely have a gambling addiction:
  1. You engage in high volume trading, where "action" is more compelling than the objective of the trade;
  2. You are constantly preoccupied with your investments;
  3. You need to invest more and more money or increase your leverage to feel excited;
  4. You have repeatedly tried to stop or control your market activity and failed;
  5. You become restless and irritable when you try to cut down or stop investing;
  6. You invest to escape problems, relieve depression, or distract yourself from painful emotions;
  7. You sometimes have to increase your position in an investment after a loss - chasing your losses;
  8. You have lied to conceal the extent of your involvement in the market;
  9. You have committed an illegal act to finance your market activity;
  10. You are jeopardizing significant relationships or your job because of excessive involvement in the market;
  11. You have relied on others to bail you out when you got into desperate financial situations.
Tally up your score. For those who scored five or higher, why not check out a Gambler's Anonymous meeting near you?


JW

Adapted from Canadian Business.

The Confused Capitalist

Tuesday, October 10, 2006

ETFs - Blow your horn

I've read a few articles around the net yakking it up about how many ETFs are, essentially, replicas of other ETFs already out there. And that the 200 or so, should be enough for anyone, right? Many have really puckered up to that trumpet, and are blowing hard.

There's about 8,000 mutual funds out there, and people think that 2.5% of that in ETFs is enough? Pulleeze!

I don't hear too many financial advisor's saying that the doors should be shuttered on the 90% of mutual funds which are essentially replica's of each other AND underperform the market. Would their silence on this issue be because of the juicy trailer fees that accrue with mutual fund recommendations, and their squawking about ETFs due to the limited to no trailer fees?

Before you believe those puckered up to blow on the "200 is too many" sheet music, check their knowledge, motives and whether they're protesting the outrageous number of mutual funds.

When I see an ETF for every industry type, for every single country, for every capitalization size, and for every type of outperforming back-tested fundamental and enhanced indexing style there is, using rules-based entry strategies, and virtually every combination thereof, TIMES TWO, then I might start to agree with those already puckered up on the "there are too many" trumpet.

Until then, ETFs, until then, blow your own horn baby. Blow sweetly and with all the range of melodies available in the investment world.


JW

The Confused Capitalist

Monday, October 09, 2006

Blog Quality Continues to Impress This Blogger

Just been taking a recent tour around many new (or new to me) stocks/investing/market commentary blog sites. The quality even from so-called amateurs is amazing, as is the explosion of blogs.

It's getting hard to see all the new stuff, there's so much of it coming on so often ... all good for the consumer ... makes Jim Cramer's crap seem more like, well ... crap ...

I'll probably be adding numerous links to my site fairly soon, based on my travels to some of these great blogs ...


JW

The Confused Capitalist