Showing posts with label themes. Show all posts

Thursday, September 11, 2008

Market Tremors

Image: Portland Oregon skyline, Mt Hood in background.

In my family of origin, reading something you thought interesting to a sibling, parent or child was a sign of love and affection, as well as a way to stay connected and to expand your world. Receiving one of those readings was taken similarly.

So, on a recent multiple-family shopping expedition to Portland, I asked my wife to read to me, as I ground it out for the fifth hour on the freeway on our way there.

“Read what?”, she asked.

“Globe & Mail – business pages, please.”, I replied.

But then I glanced down at the paper and saw the front page headline – “Markets Pounded – TSX/S&P drops 7% over past three days”. Knowing my wife’s market nervousness, I told her to skip the reading. Instead of it being an enjoyable pastime for us both, I know she’d be pounding me with questions about our holdings, feeling sick if we lost anywhere near the average and dismal if it was more.

Which brings me to the point of this exercise: she reacted just like many people do. At a sign of market decline, they seriously question the market in general, and their holdings in particular.

Unfortunately, it is usually only at times of market extremes like these that people begin ask these questions, and it is usually in this order:

1. Market Exposure – Am I comfortable with the levels of equities I hold?

2. Holdings – What are my specific holdings – what is their orientation, what is their risk profile? How much am I counting on “the future” (potential growth of earnings etc.), rather than “the past” (historical earnings, etc.)?

3. Emotions – What is my emotional readiness to handle declines or lags in my portfolio, without changing strategies?

4. Rationale – What was my thought process for assembling this particular portfolio, and how well will this rationale hold up if market conditions are reversed?

5. Process – What process and tools did I use to construct this portfolio? Have I given myself an edge in some way?

In a bear market, the predictable answers to #1 and #2 are “I have too much equities – I need to lighten up”, and “I have too risky holdings, I need to sell”. In a bull market the answers are of course reversed. Typically, whether in a bull or bear market, few bother to get around to questions #3, #4, and #5.


If you want to outperform the market, aside from being willing to assemble a portfolio that looks unlike the market – and all the perceived and real risk that can entail - you need to spend considerable time on questions #3, #4 and #5.

In fact, I believe you need to reverse the order of asking these questions. That’s because they form the long-term framework for sticking with your ideas. And retail investors are notorious for dumping both their strategies and equities, just as market conditions begin to favor those very equities and strategies.

So, over the course of the next few postings, we’ll look more deeply at all these questions, in what I regard as the proper order (1. Process; 2. Rationale; 3. Emotions; 4. Holdings; 5. Market Exposure), through the lens of my own recent portfolio reconstitution.

(This series will be published every Monday and Thursday until complete)


JW

The Confused Capitalist

Wednesday, October 25, 2006

Why outperforming the S&P 500 must become a priority for younger investors

This is a longer than average post, but if you are in your 20s, 30s or 40s and are counting on a decent retirement based on a financial planners' estimate of a 10% market return or so, I suggest you stick with this and read it through. For many readers, this will be eye-opening to say the least.

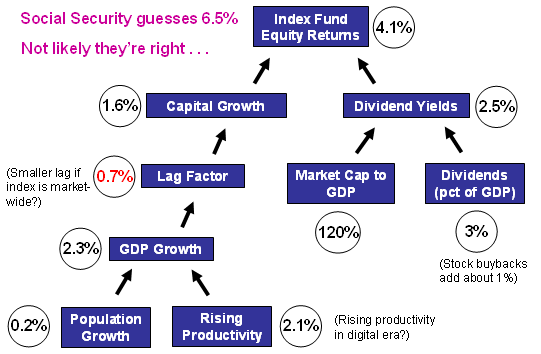
The following diagram is from work of Steven Johnson of Simcivic.org and illustrates what he believes the future composition of the return rate (see below) of the S&P500 is likely to be (with inflation extracted): (Future returns above: Click to enlarge)

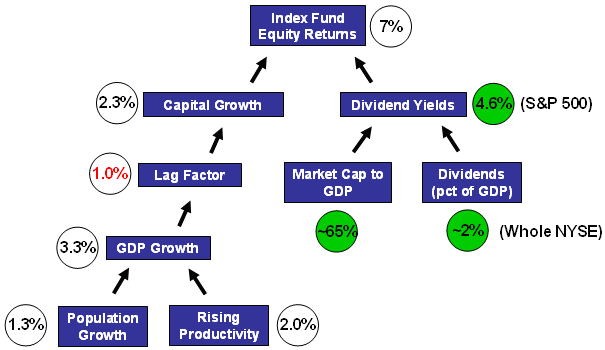
In this diagram, Mr. Johnson has outlined what he believes the constituent parts of future stock market returns are likely to be (inflation excluded). This shows a 4% return or so, compared to a historical 7% return (again, inflation excluded), which he calculates as having been historically produced by the following constituent components (see below: historical return):

(Historical returns above: Click to enlarge)

Adding inflation back into both figures, produces an anticipated future return rate of about 7%, versus a historical 10% or so. While a 3% differential doesn't sound large, over a 30 year period, this differential amounts to $10,000 being turned into $76,122 (7%) or $174,494 (10%). [Both figures now include an inflation component of an additional 3%.]

As you can see, the difference between these two figures could significantly affect your retirement planning. Mr. Johnson makes a pretty compelling case that the returns of the past cannot be relied upon as a reasonable guide for indicating the returns of the future. It's different this time he claims: this time in a negative sense!

In the paper Mr. Johnson argues that stock market returns arise from two primary sources. These are capital growth, historically accounting for about 2.3% of the 7% long-term (ex. inflation) rate; and dividends - including re-investment and share-buybacks - accounting for about 4.6% of the 7% (ex. inflation) historical return. Together, the two components produce a ~7% return (1.023 x 1.046 = ~ 7% return).

Mr. Johnson then further deconstructs the return to be able to analyze what might happen in the future, given known trends. The capital return factor (~2.3% historically) is the result of three things:
  1. Population growth in the 20th century of about 1.3% per annum;
  2. Plus rising productivity of about 2.0% per annum;
  3. Less a lag factor of about 1%
Producing a net 2.3% factor on the capital growth side.

On the dividend side, the components there are the actual dividends paid compared to the overall economy and the market capitalization of the stock market, compared to the overall GDP. Historically over the past seventy years, this has averaged 65% or so.

The ratio of dividends paid, measured by the GDP of the economy has remained relatively constant, at about 2% of the GDP. Accounting or adding for stock buy-backs, this figure rises by about 1% to become about 3%.

The 3% dividend figure is then divided by the denominator, which is the ratio that the stock market has been capitalized at compared to the GDP of the economy (historically about 65% as a long-term average), produces the aforementioned 4.6% figure.

Reiterating, the two components produce a ~7% return (1.023 x 1.046 = ~ 7% return).

Mr. Johnson argues that in the future, these underlying rates will be different (mostly lower), due primarily to two trends:

  1. Population growth is slowing, and he uses a 0.2% annual estimate (from Social Security figures) instead of 1.3%. This alone lops off more than 1%.
  2. The stock market has gradually been valued as a higher and higher percentage of GDP. This is the denominator of the dividends return portion. In fact, this appears to be on an upward trend that Mr. Johnson believes may average out at 120% of the GDP, nearly twice the historical level. Given the massive trend of the average person now investing in the market - compared to being a rich man's playground 50 years ago - it's hard to argue with this idea, even if the figures might not prove exactly right. Dividing the dividends of 3% by the average capitalized 120% ratio produces a dividend yield of about 2.5%, some 2% below what Mr. Johnson estimates this portion historically produced.
Incidentally, the falling yield portion as a value of stocks is pretty indisputable, and can be seen on one of the numerous charts within the paper that help make all this understandable, and compelling.

Hopefully, I have explained this well enough that most people can understand the basics of it, even if some of the subtly is lost. I cannot impress upon you strongly enough that you go and read the paper yourself, and try to understand the implications for your retirement planning.

I will be writing more on market outperformance in the future, and re-visiting some ideas from some of my older postings.


JW

The Confused Capitalist

Wednesday, August 23, 2006

Investing via themes ... or via financial statements

Over at Random Rogers, (Roger Nusbaum), a fellow blogger I read nearly every day, he's really big on investing in themes.

Given that Roger is a big proponent of ETF investing, that stands to reason. Roger's forte is obviously trying to enhance returns by not just investing in low-cost investment vehicles like ETFs, but then trying to sweeten those returns by looking at other big sweeping factors that'll influence values: investment themes.

I've learned a considerable amount from Roger and using his ideas to broaden my own thinking, portfolio holdings, and returns; in fact, my propensity to recommend emerging markets as a huge, long-term and reasonably-priced theme, owes much to Roger's thinking style.

Having said that, however, I also think that thematic investing requires a certain amount of patience and isn't necessarily suited to every investor. For instance, being right about the theme of commodities being underinvested in, in the late 1980s and early 1990s, would have been completely right, but far too early to make any money from it.

Sometimes, the theme is right, but the market is wrong: a situation of theoretical low risk, but also of low/no/negative returns. By the time the market realizes you were right - you could well have exited the theme: who's got the patience to wait ten years to be proven right?

For some investors with the appropriate skill set (an ability to read financial statements chief amongst them), an idea needing less patience is investing by value situations. What "value" means is finding the right combination of value and growth, at a favorable price. In fact, at a price that you think is completely unfair to the seller. Hence, you become a buyer.

When you can find appropriate situations like that, you don't have to wait around for the theme to unfold.

For instance, the legendary value investor Marty Whitman discusses in his book, The Aggressive Conservative Investor, investing in Japanese non-life insurance companies for years during the brutal Nikkei decline from 1997 to 2004 (a decline in the index that cut the index value in half). Yet, because of his ability to ferret out value, his Third Avenue fund was able to earn an annual 10% compound return on those Japanese assets over that period. No need for the "Japanese" theme to unfold. Instead, a hunt for value provided a decent return, without requiring the patience of Job.

At times, value investors are able to combine the idea of thematic investing with ordinary value investing to achieve extraordinary results.

So don't forget to check your own toolbox as an investor, and attempt to put more tools in there that you can use during your investing years. Thematic and value investing: a potent (but infrequent) combination.


JW

The Confused Capitalist

Wednesday, May 24, 2006

Commodities - Which way? (updated)

The recent direction of the stock markets seem fairly clear, and for anyone who's got any doubts, these two (one, two) recent postings by Barry Ritholtz over at The Big Picture should help clarify things. The market, overall, seems poised to continue moving down - or at best - sideways. Yet, as always, even in soft markets, some stocks - or groups thereof - will continue to make gains.

The largest seemingly identifiable group that is likely to continue significantly differentiating itself from the broader market is commodities - mainly minerals, and oil & gas.

The only question is - which way?

Goldman Sachs analysts Arjun Murti and Brian Singer surprised the markets in March 2005 by calling for $100/barrel oil. While it may have been headline surprise, it was only a reiteration of similar calls for continued oil prices at increasingly elevated levels. More recently, pundits on both sides have pointed to a myriad of evidence supporting both higher and lower prices - pointing to things like increased demand from rapidly industrializing China and India, and potential for disruption from Iran, etc. - and on the other side - speculators keeping the price high. Seemingly authoritative sources on both sides make compelling arguments for both directions.

Other commodities too, had well known prognosticators on both sides of the fence point to imbalances. A recent letter from investment guru Bill Miller of Legg Mason suggests that the boom is more likely to be nearing the end, than in the middle of a tear. Superinvestor Warren Buffett also suggested in verbal comments (use browser tool to search for "commodities" within the article) made at the 2006 annual weekend conflab in Omaha, that commodities were subject to some speculative excesses although the comments were somewhat vague in nature.

Surveying the scene, it's possible to become utterly confused as to which way commodities might move. Investment guru and commodities expert Jim Rogers (co-founder of the Quantum Fund with billionaire George Soros) says that while commodities may in the midst of a "big correction" lasting anywhere from three months to two years, that this is a secular (commodities) bull market with another 15 years to run, "because supply and demand are so out of whack".

One can never be certain of course, and it's difficult to see exactly who's right: well-known conservative investors (i.e. Miller, Buffett, etc.), or other renowned experts like Rogers.

Me, I just keep thinking China and India growing economically at 7-10% a year, with their two and a half billion citizens. That, my friends, is a lot of demand. Are prices out of whack? Frankly, I don't know, but I very much doubt we are in the seventh inning in this particular game.

On the other hand, it's important to remember that even favorable long-term investment winds can't rescue an investor if he/she paid a wild price for their asset. Just ask anyone in the "NASDAQ 5000" club.

N.B. 7:22AM PST May 25 Update:

One thing I personally would NOT do, is to invest directly in the underlying commodity index, as seems so popular these days, by the roll-out of various commodity-indexed ETFs. As CIBC World Markets chief economist Jeffrey Rubin pointed out in some market commentary, the stocks of commodity companies typically lag the leading indicator (the spot price, usually) in a commodity rally for a long period of time.

Both the imputed price of the underlying commodity is much lower (in 2005, Mr. Rubin said most oil companies had a value which imputed oil in the high $20s or low $30s per barrel, for instance). The longer the rally goes on, the more the stock price begins to close the gap, AND begins to experience multiple (i.e. PE ratio) expansion.

This suggests that the best way to invest in a commodity bull market, is in the early phases invest directly in the commodities themselves, and later, through stocks. I personally feel that we're into the second part of that investment thesis, and the best days of the first portion are already behind us.


JW

The Confused Capitalist

Friday, March 03, 2006

Energy Demand: Nuclear Renaissance?

As investors, it pays to be ahead of the rest of the investing crowd. Nuclear energy may offer one such option. While the focus of the Wall Street crowd today is oil and gas, future gains in uranium may vastly outstrip those remaining in the oil and gas field.

Today, it's estimated that, in addition to the 440 operational nuclear plants around the world, there'll be another 60 on-line to serve the growing world-wide energy demand, by 2020. Additionally, some environmentalists, such as James Lovelock, Ph.D., now embrace nuclear power as the only way to avoid complete environmental catastrophe. Add to that the obvious demand that will continue to occur as China's and India's 2.2 billion citizens become part of industrialized societies and the demand side of the equation is obvious.

What is less obvious is that the uranium industry has been undermining for years, perhaps even decades now. This deficit, currently estimated, at about 25 million pounds annually (of a total demand of 150 million pounds), has been met by the over-stockpiling of uranium from the 1950s-1970s, and by the decommissioning of Soviet nuclear weapons in this decade and the 1990s.

However, the "well is running dry", so to speak as these sources are themselves being drained. All of which leads us to a long-term investment thesis, of uranium producers experiencing very good gains for a lengthy time period, perhaps as long as ten years. Uranium mine approvals, world-wide, are subject to obvious governmental red-tape and this is only overcome at considerable time and expense.

In the interim, sit tight and enjoy what I believe will be superior medium to long term investment gains. The largest global producer of uranium is Cameco, on the NYSE as "CCJ".


JW

The Confused Capitalist