Showing posts with label return rate. Show all posts

Tuesday, January 01, 2008

Report Card - Predictions in Review

This is the time of year when many financial columnists and bloggers review their picks, predictions and suggestions made during the past 12 months.

I'm not going to do that, since this blog specifically makes the point that investing is a longer-term process, and picking your winners and losers an average of just six months later is foolish and leads to thinking which doesn't improve your long-term results.

What I am going to do is review the 2006 predictions and suggestions I made, providing a better longer-term outlook.

This blog started in February 2006, and on Feb 19th I looked at a portfolio heavy in dividend companies, with the hope that the dividend growth over about 5 years or so, would then pay enough in dividends to make a theoretical mortgage payment used to buy those securities with. Based on history, I was looking for a 10% annual portfolio growth, with about 5% of that coming from dividends, and 5% from capital growth.

Overall, the portfolio is up 12%, plus the dividend yield of about 5% annually, which is producing a return pretty much bang on. The dividends have also grown, from 4.75% annually of the initial portfolio value, to 5.08% annually now. Call that a win overall.

Incidentally, with long-term mortgage rates now in the 5.3% (15yrs) to 5.8% (30yrs) range, now is an excellent time to revisit that same strategy, although I expect the portfolio might well get stuffed today with many more financial firms, given some of their perceived difficulties and consequent high yields. Read the entire Leverage Series.

Emerging markets was a popular theme for me, calling them good value in March/06, May/06 and October/06. Buying the most-popular emerging markets ETF, "EEM", you'd be up anywhere from 45% to 55% depending upon your entry point. The S&P 500 moved up only 10-15% over that same period. Call that a clear victory.

I also suggested in March/06 that uranium producers had a long tailwind in their industry, given decades of under-mining the resource and shortages to come. The world's largest single uranium producer, Cameco ("CCJ") moved up by just 5% since then, against a 14% increase in the S&P500. However, since then, Cameco has also been plagued with production problems, which has likely impaired its stock price. Still, call this a loss.

In early March/06, I also warned that I felt the US currency would continue its descent, and later re-iterated this call in April. Since the initial call, the US dollar has lost 18% when measured against its largest competitor currency, the Euro. Call this a win.

Also in March, when many were suggesting that Berkshire's Warren Buffett had his better days behind him, I suggested it would be too early to count an extraordinary investor like him out. Since then, Berkshire shares have risen by 63%, rising from $87,400 to $142,200. Call this a win.

In mid-March, I felt that the oil-boom in Alberta Canada, was going to continue to positively impact their real estate sector, and suggested three companies who would likely be prime beneficiaries. Since then, these stocks have risen by an average of 42%, against Canada major stock index, the S&P/TSX60 (represented by the ETF "XIU" on the TSX) which has risen by 20% since then. Call this another win.

In late March, I suggested that inflation was on the upswing (a win), and that as a result of this, US homeowners would be wise to lock-in their variable rate mortgages (ARMs) to 15 or 30 year fixed rates, as rates will be higher in 2-3 years, and much higher in 5-7 years. While the jury is technically still out, long-term fixed mortgages were in the 6.25% range then. The freeze-up in the credit markets has resulted in the Fed dropping its rates, and 15-30 year fixed mortgages are now in the 5.3% (15 yrs) to 5.8% (30yrs) today. Call this a loss.

In April/06, I suggested that constructing a simple, sensible, long-term portfolio was as simple as "1,2,3 - A,B,C". That portfolio used just six ETFs, tracking both domestic and international markets. The portfolio gave consideration to value type investments, as well as growth through a 25% holding in emerging markets. It was also much more balanced internationally than most investors holdings, with 60% of its holdings outside of the US market. This portfolio has returned 22%, against an 11% increase in the ETF "SPY" (which tracks the S&P 500). Call this a clear win.

In April, I also suggested that the US market had reached its peak for quite a while to come - since then the S&P 500 has risen by 14%. Call this a clear loss.

In April/06 I also said that Canada's Ontario land-title provider Teranet (TF.UN), would likely jump upon its IPO issue to reflect a lower yield. While that did happen, it also fell subsequently on some poor results. Call that one a draw.

Looking back now, it seems like an easy call to say that the US residential real estate was going to get trashed, but then, not so many were certain of that. I made calls on this sector in March/06 saying it was too hot and re-iterated that again in June/06. In July/06, I twice advised against investing in home-builders or related stocks, warning that "it won't be pretty out there in two to four years". This warning came despite some sensible bloggers, notably Geoff Gannon and Bill of No-Do-Das, suggesting they looked like good long-term investments. Depending on which point you use, the home-builders ETF "XHB" has fallen by as much as 55% since then. Call this a can of "whupp ass" victory.

In September/06, I suggested another simple ETF portfolio, this time for Canadian investors, using just four ETFs. This one would have half of the portfolio invested outside of Canada, with the balance in the country. That portfolio is up 37% on a local (Canadian) currency basis, compared to a 22% improvement in the country's major index (S&P/TSX60). Call this another clear win.

Finally, in November/06, I suggested an investment in the leveraged split shares of LSC and ALB (trading on Canada's TSX) exchange representing several Canadian insurers and banks respectively, looked like good value. Since then then have fallen by an average of 2%, against the S&P/TSX60 increase of 13%. Call this a clear loss.


Well, that's about it - the way I read this is that I got almost all the major calls right - that is, the portfolio suggestions, the ETF builders (e.g. emerging markets, etc.), currency calls, and the real estate meltdown. And while I was right on the inflation rate indications (upward), I didn't anticipate the Fed dropping rates due to the credit market freeze up. And I also missed on a few individual stock predictions. However, I would say that my biggest miss was calling a US market high in April 2006. Overall, though, I'm pleased with how the suggestions have turned out.

I hope that my 2007 predictions and suggestions look as good in 2009 as these ones generally have.

PS (Jan 6/08): I now also recall a 2006 year end survey by Birinyi Associates who run the Blogger Sentiment Poll, asking which S&P500 stock did I think had the potential for the greatest increase over the year. I selected Coke, "KO", which closed on the trading last day of 2006 at $48.25 and the last day of 2007 at $61.37, for a 27.2% increase. By comparison, the ETF "SPY" (representing the S&P500) gained just 3.2% over the same period. Call that also a clear win.

Note: If you're on a blog aggregator, you can visit The Confused Capitalist here (or here: http://confusedcapitalist.blogspot.com/) for additional articles and exclusive content!


JW

The Confused Capitalist

Thursday, March 22, 2007

A superior index arises: just a better mousetrap

This can either be read as a stand-alone posting relating to why fundamental indexing is a better way to go than tracking a conventional index, or it can also be read as part two of two of a book review of "The Little Book of Common Sense Investing", by John Bogle.

As relayed in part one of my review, I found the evidence presented by Mr. Bogle to be almost overwhelming that investing in a low-cost index fund was virtually the only way for the average equity investor to outperform the broad market, like the S&P 500, over time. A very good method as the book clearly details.

However, in the book (chapters 12, 14, 15 and 16), Mr. Bogle suggests that some of the new fundamental indices (e.g. FTSE RAFI) aren't going to stand up to the test of time, as market capitalization-weighted indices (such as the S&P 500) have. He intimates that, having seen various "better mousetraps" come and go, so too will fundamental indexing (which back-testing shows has outperformed a cap-weighted by nearly 2% annually, a huge margin). This is essentially, he claims, just another method to part the foolish from their prospect of future returns.

He denigrates the back-testing of these fundamental indices as if that was somehow undesirable. I personally fail to see the difference between the back-testing done there, and Mr. Bogle's own back-testing that led him to the conclusion that low-cost index investing was going to beat the then conventional mutual fund of the day (an advantage that has continued to hold up to this day).

Mr. Bogle fairly asks the question of why these fundamental factors (fundamental factors are centered on accounting items, like book value, dividends paid [or dividend growth rates], earnings, revenues, etc.) have not been properly exploited by stock markets in the past? While there have been tons of academic studies pointing out that a stock-picking method using virtually any of the aforementioned factors as a major stock-picking factor would have outperformed the broader market, that still doesn't really answer the question.

The question is best answered by examining behavioural research. In other words, it has to do with the emotional nature of people, something that even mutual fund managers are subject to, as clearly evidenced by the typical 100% turnover on the conventional mutual fund. Certainly, they also appear to be "taken in" by a "good story", as much as anyone. For more insight on this issue, see the following (warning: large pdf file) commentary, Seven Sins of Fund Management. In short, the problem is, my dear Mr. Bogle, interference from human beings.

Just as Mr. Bogle was then a pioneer of the day, by exploiting something seemingly obvious and mundane (i.e. 1. costs matter and 2. don't get trapped by "the story") it seems hard to believe that no one can build a method for a relatively sustainable advantage over a conventional index. In the future, the building of these fundamental indices today will probably be seen as something that should have occurred much earlier, given their obvious superiority.

But getting back to the business at hand, if, as alleged by Mr. Bogle early in the book, that long-term investment returns more or less parallel the returns of the stock market of the underlying businesses, doesn't it make sense to construct an index which actually gives weighting to those factors, as opposed to the more temporary and whimsical valuations imposed by market activity?

Doesn't it make sense to try and limit or exclude the "speculative" return (positive and negative) he discusses, which is, essentially, the contribution (deduction) to (from) short-term returns from stocks becoming over (under) priced? Fundamental indices attempt to do that: exclude the most-egregiously over-priced stocks, by fundamentally examining the books of each company. Conversely, these indices also include more of the relatively undervalued companies. That these indices might succeed over the longer-term would be due to the rules-based inclusion of companies into the index. A fairly simple, but effective, way of eliminating or minimizing poor investment decisions: rules!

After a time, I think Vanguard, Bogle, and other indexers will recognize that these are superior indices. Then, more index funds will be created to track them. Because the basis of inclusion into these indices are the actual economic activity of the companies themselves, rather than the more capricious valuations assigned by the market activity of the moment, they can finally answer a question Bogle poses in the book: How to know which companies are over-valued in a conventional index? Effectively, the books of the companies themselves answer that question.

In the end, an index that examines the fundamentals of companies in some manner simply has to be better than one which only considers the temporary selling prices of their stocks. Vanguard and others will finally realize this, and bring the same ruthlessness to cutting costs that they did to tracking the S&P 500, for instance.

Whether these indices will continue to significantly outperform conventional capitalization-weighted indices starting twenty years from now, the answer is "probably far less" than current back-testing has shown was available. As the "rise of the machine" eliminates emotional interference (1, 2) from making "on mass" good investing decisions, these market inefficiencies will be exploited such that they will disappear over time. And while the costs are currently slightly higher for these ETFs (about 0.5% annually) than an extreme low-cost conventional index-tracker (about 0.19%), the cost/benefit equation seems to be worth it (i.e. you pay an extra 0.3% or so, to get about 2% more).

In the interim though, as these inefficiencies are finally properly captured over the next decade or two, it's possible that excess returns will even exceed that shown in back-testing. And any advantage that is likely to persist over ten to twenty years isn't something to be ignored, in my view.

Anyone with a broadband connection and who wants to really understand the multitude of reasons why these are superior indexes, are suggested to go to these two (one, two) video presentations, by Rob Arnett of Research Affiliates.


JW

The Confused Capitalist

Saturday, March 17, 2007

S&P 500 Future Returns

Readers may wish to take the investment poll located on the right hand side of the blog which asks what you expect the S&P 500 rate of return to be over the next 10 years.

Thanks to Geoff Gannon of Gannon on Investing for providing this poll.

JW
The Confused Capitalist

Wednesday, October 25, 2006

Why outperforming the S&P 500 must become a priority for younger investors

This is a longer than average post, but if you are in your 20s, 30s or 40s and are counting on a decent retirement based on a financial planners' estimate of a 10% market return or so, I suggest you stick with this and read it through. For many readers, this will be eye-opening to say the least.

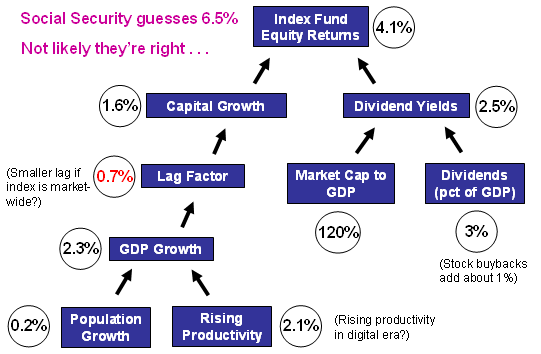
The following diagram is from work of Steven Johnson of Simcivic.org and illustrates what he believes the future composition of the return rate (see below) of the S&P500 is likely to be (with inflation extracted): (Future returns above: Click to enlarge)

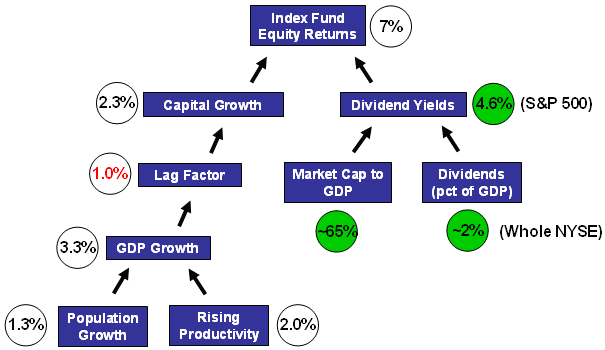
In this diagram, Mr. Johnson has outlined what he believes the constituent parts of future stock market returns are likely to be (inflation excluded). This shows a 4% return or so, compared to a historical 7% return (again, inflation excluded), which he calculates as having been historically produced by the following constituent components (see below: historical return):

(Historical returns above: Click to enlarge)

Adding inflation back into both figures, produces an anticipated future return rate of about 7%, versus a historical 10% or so. While a 3% differential doesn't sound large, over a 30 year period, this differential amounts to $10,000 being turned into $76,122 (7%) or $174,494 (10%). [Both figures now include an inflation component of an additional 3%.]

As you can see, the difference between these two figures could significantly affect your retirement planning. Mr. Johnson makes a pretty compelling case that the returns of the past cannot be relied upon as a reasonable guide for indicating the returns of the future. It's different this time he claims: this time in a negative sense!

In the paper Mr. Johnson argues that stock market returns arise from two primary sources. These are capital growth, historically accounting for about 2.3% of the 7% long-term (ex. inflation) rate; and dividends - including re-investment and share-buybacks - accounting for about 4.6% of the 7% (ex. inflation) historical return. Together, the two components produce a ~7% return (1.023 x 1.046 = ~ 7% return).

Mr. Johnson then further deconstructs the return to be able to analyze what might happen in the future, given known trends. The capital return factor (~2.3% historically) is the result of three things:
  1. Population growth in the 20th century of about 1.3% per annum;
  2. Plus rising productivity of about 2.0% per annum;
  3. Less a lag factor of about 1%
Producing a net 2.3% factor on the capital growth side.

On the dividend side, the components there are the actual dividends paid compared to the overall economy and the market capitalization of the stock market, compared to the overall GDP. Historically over the past seventy years, this has averaged 65% or so.

The ratio of dividends paid, measured by the GDP of the economy has remained relatively constant, at about 2% of the GDP. Accounting or adding for stock buy-backs, this figure rises by about 1% to become about 3%.

The 3% dividend figure is then divided by the denominator, which is the ratio that the stock market has been capitalized at compared to the GDP of the economy (historically about 65% as a long-term average), produces the aforementioned 4.6% figure.

Reiterating, the two components produce a ~7% return (1.023 x 1.046 = ~ 7% return).

Mr. Johnson argues that in the future, these underlying rates will be different (mostly lower), due primarily to two trends:

  1. Population growth is slowing, and he uses a 0.2% annual estimate (from Social Security figures) instead of 1.3%. This alone lops off more than 1%.
  2. The stock market has gradually been valued as a higher and higher percentage of GDP. This is the denominator of the dividends return portion. In fact, this appears to be on an upward trend that Mr. Johnson believes may average out at 120% of the GDP, nearly twice the historical level. Given the massive trend of the average person now investing in the market - compared to being a rich man's playground 50 years ago - it's hard to argue with this idea, even if the figures might not prove exactly right. Dividing the dividends of 3% by the average capitalized 120% ratio produces a dividend yield of about 2.5%, some 2% below what Mr. Johnson estimates this portion historically produced.
Incidentally, the falling yield portion as a value of stocks is pretty indisputable, and can be seen on one of the numerous charts within the paper that help make all this understandable, and compelling.

Hopefully, I have explained this well enough that most people can understand the basics of it, even if some of the subtly is lost. I cannot impress upon you strongly enough that you go and read the paper yourself, and try to understand the implications for your retirement planning.

I will be writing more on market outperformance in the future, and re-visiting some ideas from some of my older postings.


JW

The Confused Capitalist